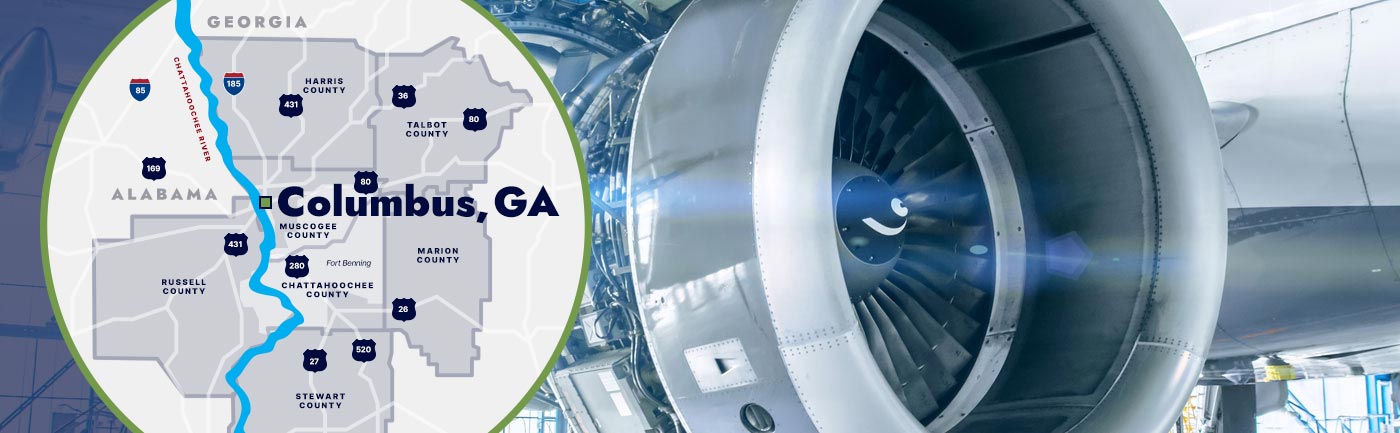
Columbus, GA MSA
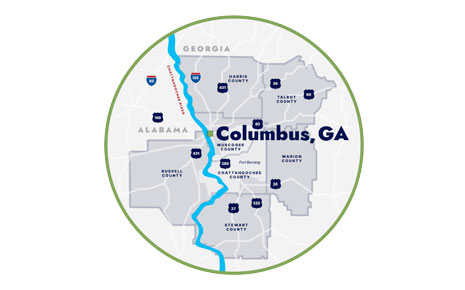
Covering Chattahoochee, Harris, Marion, Muscogee, Stewart, and Talbot Counties in Georgia, and Russell County in Alabama.
Population
Back To Top
Back To Top
Population
| Population | 2000 | 2010 | 2026 | 2031 |
|---|---|---|---|---|
| Columbus, GA MSA | 406,376 | 444,943 | 514,825 | 530,769 |
Source: ESRI, 2026-01-12
Population by Age
| Population | 2026 |
|---|---|
| 0-4 | 30,365 |
| 5-9 | 31,537 |
| 10-14 | 31,530 |
| 15-19 | 35,926 |
| 20-24 | 48,813 |
| 25-29 | 37,425 |
| 30-34 | 37,156 |
| 35-39 | 32,714 |
| 40-44 | 31,704 |
| 45-49 | 28,683 |
| 50-54 | 28,859 |
| 55-59 | 27,989 |
| 60-64 | 29,151 |
| 65-69 | 27,433 |
| 70-74 | 22,267 |
| 75-79 | 16,294 |
| 80-84 | 9,423 |
| 85+ | 7,557 |
| 18+ | 402,198 |
| Median Age | 36 |
Source: ESRI, 2026-01-12
Population by Race
| Columbus, GA MSA | 2026 |
|---|---|
| Total | 514,825.00 |
| White Alone | 51.64% |
| Black Alone | 34.96% |
| American Indian Alone | 0.4% |
| Asian Alone | 3.29% |
| Pacific Islander Alone | 0.2% |
| Some Other Race | 2.94% |
| Two or More Races | 6.57% |
| Hispanic Origin | 7.01% |
| Diversity Index | 65.60 |
Source: ESRI, 2026-01-12
Growth Rate
| Columbus, GA MSA | 2026 - 2031 |
|---|---|
| Population | 0.61% |
| Households | 0.85% |
| Families | 0.67% |
| Median Household Income | 2% |
| Per Capita Income | 2% |
Source: ESRI, 2026-01-12
Housing
Back To Top
Households
| Population | 2000 | 2010 | 2026 | 2031 |
|---|---|---|---|---|
| Households | 153,467 | 172,991 | 206,740 | 215,673 |
| Housing Units | 170,292 | 195,382 | 228,161 | 237,486 |
| Owner Occupied Units | 117,932 | 125,156 | ||
| Renter Occupied Units | 88,808 | 90,517 | ||
| Vacant Units | 21,421 | 21,813 |
Source: ESRI, 2026-01-12
Home Value
| Columbus, GA MSA | 2026 | 2031 |
|---|---|---|
| Median Home Value | $262,626 | $326,283 |
| Average Home Value | $296,973 | $366,201 |
| <$50,000 | 8,493 | 6,454 |
| $50,000 - $99,999 | 10,074 | 5,818 |
| $100,000 - $149,999 | 11,695 | 6,348 |
| $150,000 - $199,999 | 12,205 | 7,607 |
| $200,000 - $249,999 | 12,168 | 9,890 |
| $250,000 - $299,999 | 17,050 | 18,280 |
| $300,000 - $399,999 | 22,049 | 31,026 |
| $400,000 - $499,999 | 10,645 | 17,282 |
| $500,000 - $749,999 | 8,994 | 15,293 |
| $1,000,000 + | 642 | 1,103 |
Source: ESRI, 2026-01-12
Housing Year Built
| Year Range | Houses Built |
|---|---|
| 2010 or Later | 27,987 |
| 2000-2009 | 39,694 |
| 1990-1999 | 35,583 |
| 1980-1989 | 28,053 |
| 1970-1979 | 29,976 |
| 1960-1969 | 22,225 |
| 1950-1959 | 17,501 |
| 1940-1949 | 7,827 |
| 1939 or Before | 10,059 |
Source: ESRI, 2026-01-12
Back To TopIncome
Back To Top
Income
| Columbus, GA MSA | 2026 | 2031 |
|---|---|---|
| Median Household | $58,938 | $66,598 |
| Average Household | $83,011 | $92,750 |
| Per Capita | $33,448 | $37,798 |
Source: ESRI, 2026-01-12
Household Income
| Columbus, GA MSA | 2026 |
|---|---|
| <$15,000 | 30,750 |
| $15,000 - $24,999 | 16,522 |
| $25,000 - $34,999 | 17,378 |
| $35,000 - $49,999 | 25,036 |
| $50,000 - $74,999 | 34,369 |
| $75,000 - $99,999 | 24,963 |
| $100,000 - $149,999 | 30,356 |
| $150,000 - $199,999 | 12,653 |
| $200,000+ | 14,706 |
Source: ESRI, 2026-01-12
Back To TopEmployees
Back To Top
Commute
| Category | Commuters |
|---|---|
| Workers 16+ | 221,846 |
| In-County Residents | 150,923 |
| Out-of-County Residents | 37,524 |
| Drive Alone | 172,052 |
| Carpooled | 19,023 |
| Public Transport | 1,913 |
| Work at Home | 19,181 |
| Motorcycle | 155 |
| Bicycle | 372 |
| Walked | 6,061 |
| Other | 2,562 |
| Less than 5 minutes | 7,427 |
| 5-9 minutes | 21,569 |
| 10-14 minutes | 33,211 |
| 15-19 minutes | 41,681 |
| 20-24 minutes | 34,033 |
| 25-29 minutes | 14,045 |
| 30-34 minutes | 22,285 |
| 35-39 minutes | 4,067 |
| 40-44 minutes | 5,284 |
| 45-59 minutes | 9,885 |
| 60-89 minutes | 4,754 |
| 90+ minutes | 4,424 |
| Average Travel Time | 0 |
Source: ESRI, 2026-01-12
Source: ESRI, 2026-01-12
Employees by NAICS
| Category | Number |
|---|---|
| Total Employees | 184,534 |
| Agr/Forestry/Fish/Hunt | 740 |
| Mining | 139 |
| Utilities | 332 |
| Construction | 8,333 |
| Manufacturing | 12,888 |
| Wholesale Trade | 4,668 |
| Retail Trade | 25,623 |
| Motor Veh/Parts Dealers | 3,437 |
| Furn & Home Furnish Str | 545 |
| Electronics & Appl Store | 399 |
| Bldg Matl/Garden Equip | 2,192 |
| Food & Beverage Stores | 5,369 |
| Health/Pers Care Stores | 2,111 |
| Gasoline Stations | 656 |
| Clothing/Accessory Store | 2,080 |
| Sports/Hobby/Book/Music | 1,973 |
| General Merchandise Str | 6,860 |
| Transportation/Warehouse | 2,983 |
| Information | 3,216 |
| Finance & Insurance | 12,853 |
| Cntrl Bank/Crdt Intrmdtn | 2,136 |
| Sec/Cmdty Cntrct/Oth Inv | 732 |
| Insur/Funds/Trusts/Other | 9,985 |
| Real Estate/Rent/Leasing | 4,629 |
| Prof/Scientific/Tech Srv | 7,394 |
| Legal Services | 1,083 |
| Mgmt of Comp/Enterprises | 160 |
| Admin/Support/Waste Mgmt | 4,515 |
| Educational Services | 19,127 |
| HealthCare/Social Assist | 30,576 |
| Arts/Entertainment/Rec | 2,631 |
| Accommodation/Food Srvcs | 22,047 |
| Accommodation | 2,855 |
| Food Srv/Drinking Places | 19,193 |
| Other Srv excl Pub Admin | 9,804 |
| Auto Repair/Maintenance | 1,513 |
| Public Administration Emp | 11,579 |
Source: ESRI, 2026-01-12
Educational Attainment (25+)
| Columbus, GA MSA | 2026 |
|---|---|
| <9th Grade | 10,227 |
| Some High School | 19,862 |
| GED | 16,494 |
| Graduated High School | 70,667 |
| Some College/No Degree | 67,817 |
| Associates Degree | 36,914 |
| Bachelor's Degree | 66,331 |
| Graduate Degree | 48,341 |
Source: ESRI, 2026-01-12
Back To TopBusinesses
Back To Top
Businesses by NAICS
| Category | Number |
|---|---|
| Total Businesses | 14,074 |
| Agr/Forestry/Fish/Hunt Bus | 67 |
| Mining Bus | 12 |
| Utilities Bus | 28 |
| Construction Bus | 971 |
| Manufacturing Bus | 378 |
| Wholesale Trade Bus | 408 |
| Retail Trade Bus | 1,961 |
| Motor Veh/Parts Dealers Bus | 274 |
| Furn & Home Furnish Str Bus | 83 |
| Electronics & Appl Store Bus | 36 |
| Bldg Matl/Garden Equip Bus | 143 |
| Food & Beverage Stores Bus | 305 |
| Health/Pers Care Stores Bus | 234 |
| Gasoline Stations Bus | 134 |
| Clothing/Accessory Store Bus | 212 |
| Sports/Hobby/Book/Music Bus | 297 |
| General Merchandise Str Bus | 242 |
| Transportation/Warehouse Bus | 277 |
| Information Bus | 261 |
| Finance & Insurance Bus | 728 |
| Cntrl Bank/Crdt Intrmdtn Bus | 357 |
| Sec/Cmdty Cntrct/Oth Inv Bus | 137 |
| Insur/Funds/Trusts/Other Bus | 233 |
| Real Estate/Rent/Leasing Bus | 752 |
| Prof/Scientific/Tech Srv Bus | 1,024 |
| Legal Services Bus | 194 |
| Mgmt of Comp/Enterprises Bus | 12 |
| Admin/Support/Waste Mgmt Bus | 533 |
| Educational Services Bus | 453 |
| HealthCare/Social Assist Bus | 1,534 |
| Arts/Entertainment/Rec Bus | 294 |
| Accommodation/Food Srvcs Bus | 1,350 |
| Accommodation Bus | 176 |
| Food Srv/Drinking Places Bus | 1,173 |
| Other Srv excl Pub Admin Bus | 2,143 |
| Auto Repair/Maintenance Bus | 289 |
| Public Administration Bus | 504 |
Source: ESRI, 2026-01-12
Back To Top