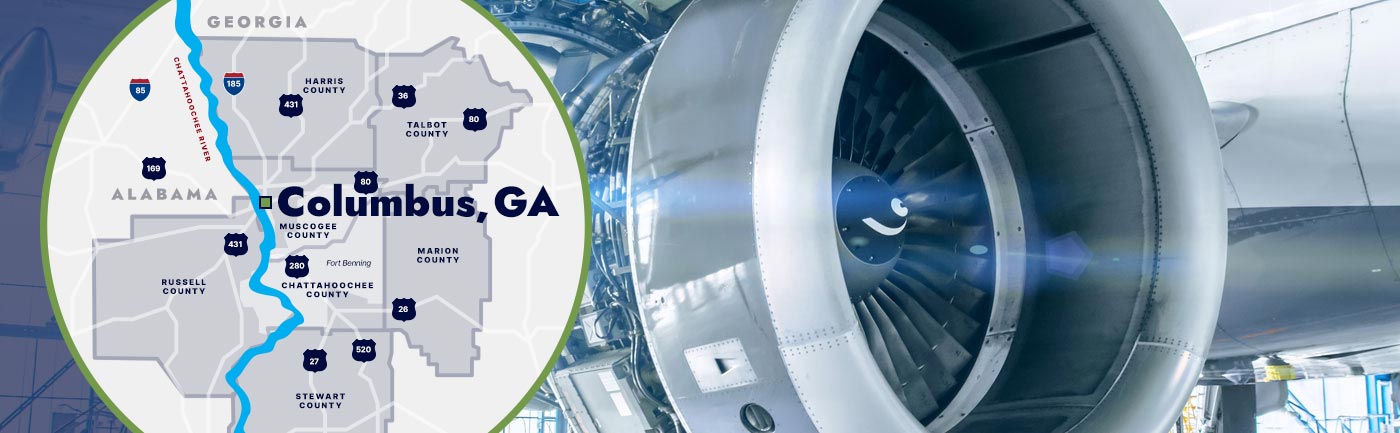
Talbot County, GA
Population
Back To Top
Back To Top
Population
| Population | 2000 | 2010 | 2025 | 2030 |
|---|---|---|---|---|
| Talbot County, GA | 6,498 | 6,865 | 5,592 | 5,472 |
Source: ESRI, 2025-08-18
Population by Age
| Population | 2025 |
|---|---|
| 0-4 | 218 |
| 5-9 | 255 |
| 10-14 | 221 |
| 15-19 | 265 |
| 20-24 | 270 |
| 25-29 | 274 |
| 30-34 | 305 |
| 35-39 | 242 |
| 40-44 | 281 |
| 45-49 | 353 |
| 50-54 | 353 |
| 55-59 | 412 |
| 60-64 | 508 |
| 65-69 | 532 |
| 70-74 | 498 |
| 75-79 | 318 |
| 80-84 | 163 |
| 85+ | 124 |
| 18+ | 4,743 |
| Median Age | 52 |
Source: ESRI, 2025-08-18
Population by Race
| Talbot County, GA | 2025 |
|---|---|
| Total | 5,592.00 |
| White Alone | 43.56% |
| Black Alone | 51.95% |
| American Indian Alone | 0.09% |
| Asian Alone | 0.38% |
| Pacific Islander Alone | 0.04% |
| Some Other Race | 0.16% |
| Two or More Races | 3.83% |
| Hispanic Origin | 3.17% |
| Diversity Index | 56.70 |
Source: ESRI, 2025-08-18
Growth Rate
| Talbot County, GA | 2025 - 2030 |
|---|---|
| Population | -0.43% |
| Households | -0.36% |
| Families | -0.55% |
| Median Household Income | 3% |
| Per Capita Income | 3% |
Source: ESRI, 2025-08-18
Housing
Back To Top
Households
| Population | 2000 | 2010 | 2025 | 2030 |
|---|---|---|---|---|
| Households | 2,538 | 2,832 | 2,477 | 2,433 |
| Housing Units | 2,871 | 3,399 | 3,035 | 2,988 |
| Owner Occupied Units | 2,023 | 2,010 | ||
| Renter Occupied Units | 454 | 423 | ||
| Vacant Units | 558 | 555 |
Source: ESRI, 2025-08-18
Home Value
| Talbot County, GA | 2025 | 2030 |
|---|---|---|
| Median Home Value | $182,866 | $263,032 |
| Average Home Value | $221,818 | $313,750 |
| <$50,000 | 338 | 298 |
| $50,000 - $99,999 | 329 | 162 |
| $100,000 - $149,999 | 199 | 100 |
| $150,000 - $199,999 | 225 | 139 |
| $200,000 - $249,999 | 229 | 208 |
| $250,000 - $299,999 | 314 | 376 |
| $300,000 - $399,999 | 125 | 198 |
| $400,000 - $499,999 | 122 | 222 |
| $500,000 - $749,999 | 94 | 191 |
| $1,000,000 + | 38 | 94 |
Source: ESRI, 2025-08-18
Housing Year Built
| Year Range | Houses Built |
|---|---|
| 2010 or Later | 199 |
| 2000-2009 | 503 |
| 1990-1999 | 775 |
| 1980-1989 | 468 |
| 1970-1979 | 326 |
| 1960-1969 | 206 |
| 1950-1959 | 225 |
| 1940-1949 | 124 |
| 1939 or Before | 243 |
Source: ESRI, 2025-08-18
Back To TopIncome
Back To Top
Income
| Talbot County, GA | 2025 | 2030 |
|---|---|---|
| Median Household | $48,394 | $55,433 |
| Average Household | $65,722 | $74,297 |
| Per Capita | $29,112 | $33,035 |
Source: ESRI, 2025-08-18
Household Income
| Talbot County, GA | 2025 |
|---|---|
| <$15,000 | 305 |
| $15,000 - $24,999 | 346 |
| $25,000 - $34,999 | 385 |
| $35,000 - $49,999 | 230 |
| $50,000 - $74,999 | 461 |
| $75,000 - $99,999 | 324 |
| $100,000 - $149,999 | 234 |
| $150,000 - $199,999 | 79 |
| $200,000+ | 113 |
Source: ESRI, 2025-08-18
Back To TopEmployees
Back To Top
Commute
| Category | Commuters |
|---|---|
| Workers 16+ | 2,321 |
| In-County Residents | 436 |
| Out-of-County Residents | 1,841 |
| Drive Alone | 1,802 |
| Carpooled | 290 |
| Public Transport | 0 |
| Work at Home | 147 |
| Motorcycle | 12 |
| Bicycle | 0 |
| Walked | 8 |
| Other | 62 |
| Less than 5 minutes | 43 |
| 5-9 minutes | 81 |
| 10-14 minutes | 125 |
| 15-19 minutes | 80 |
| 20-24 minutes | 108 |
| 25-29 minutes | 247 |
| 30-34 minutes | 339 |
| 35-39 minutes | 119 |
| 40-44 minutes | 294 |
| 45-59 minutes | 329 |
| 60-89 minutes | 212 |
| 90+ minutes | 197 |
| Average Travel Time | 41 |
Source: ESRI, 2025-08-18
Source: ESRI, 2025-08-18
Employees by NAICS
| Category | Number |
|---|---|
| Total Employees | 1,184 |
| Agr/Forestry/Fish/Hunt | 46 |
| Mining | 57 |
| Utilities | 59 |
| Construction | 16 |
| Manufacturing | 41 |
| Wholesale Trade | 21 |
| Retail Trade | 142 |
| Motor Veh/Parts Dealers | 3 |
| Furn & Home Furnish Str | 0 |
| Electronics & Appl Store | 0 |
| Bldg Matl/Garden Equip | 0 |
| Food & Beverage Stores | 18 |
| Health/Pers Care Stores | 0 |
| Gasoline Stations | 11 |
| Clothing/Accessory Store | 0 |
| Sports/Hobby/Book/Music | 4 |
| General Merchandise Str | 106 |
| Transportation/Warehouse | 25 |
| Information | 3 |
| Finance & Insurance | 22 |
| Cntrl Bank/Crdt Intrmdtn | 20 |
| Sec/Cmdty Cntrct/Oth Inv | 0 |
| Insur/Funds/Trusts/Other | 2 |
| Real Estate/Rent/Leasing | 11 |
| Prof/Scientific/Tech Srv | 21 |
| Legal Services | 4 |
| Mgmt of Comp/Enterprises | 0 |
| Admin/Support/Waste Mgmt | 12 |
| Educational Services | 331 |
| HealthCare/Social Assist | 65 |
| Arts/Entertainment/Rec | 12 |
| Accommodation/Food Srvcs | 15 |
| Accommodation | 0 |
| Food Srv/Drinking Places | 15 |
| Other Srv excl Pub Admin | 65 |
| Auto Repair/Maintenance | 7 |
| Public Administration Emp | 218 |
Source: ESRI, 2025-08-18
Educational Attainment (25+)
| Talbot County, GA | 2025 |
|---|---|
| <9th Grade | 136 |
| Some High School | 536 |
| GED | 266 |
| Graduated High School | 1,585 |
| Some College/No Degree | 691 |
| Associates Degree | 433 |
| Bachelor's Degree | 405 |
| Graduate Degree | 311 |
Source: ESRI, 2025-08-18
Back To TopBusinesses
Back To Top
Businesses by NAICS
| Category | Number |
|---|---|
| Total Businesses | 145 |
| Agr/Forestry/Fish/Hunt Bus | 4 |
| Mining Bus | 2 |
| Utilities Bus | 4 |
| Construction Bus | 5 |
| Manufacturing Bus | 2 |
| Wholesale Trade Bus | 3 |
| Retail Trade Bus | 17 |
| Motor Veh/Parts Dealers Bus | 2 |
| Furn & Home Furnish Str Bus | 0 |
| Electronics & Appl Store Bus | 0 |
| Bldg Matl/Garden Equip Bus | 0 |
| Food & Beverage Stores Bus | 7 |
| Health/Pers Care Stores Bus | 0 |
| Gasoline Stations Bus | 2 |
| Clothing/Accessory Store Bus | 0 |
| Sports/Hobby/Book/Music Bus | 2 |
| General Merchandise Str Bus | 4 |
| Transportation/Warehouse Bus | 10 |
| Information Bus | 1 |
| Finance & Insurance Bus | 3 |
| Cntrl Bank/Crdt Intrmdtn Bus | 2 |
| Sec/Cmdty Cntrct/Oth Inv Bus | 0 |
| Insur/Funds/Trusts/Other Bus | 1 |
| Real Estate/Rent/Leasing Bus | 4 |
| Prof/Scientific/Tech Srv Bus | 6 |
| Legal Services Bus | 1 |
| Mgmt of Comp/Enterprises Bus | 0 |
| Admin/Support/Waste Mgmt Bus | 6 |
| Educational Services Bus | 5 |
| HealthCare/Social Assist Bus | 9 |
| Arts/Entertainment/Rec Bus | 2 |
| Accommodation/Food Srvcs Bus | 5 |
| Accommodation Bus | 0 |
| Food Srv/Drinking Places Bus | 5 |
| Other Srv excl Pub Admin Bus | 23 |
| Auto Repair/Maintenance Bus | 1 |
| Public Administration Bus | 31 |
Source: ESRI, 2025-08-18
Back To Top